An SQL text by Erland Sommarskog, SQL Server
MVP. Most recent update 2025-08-17.
Copyright applies to this text. See here for font conventions used in this article.
This article started with a problem my co-workers had: they got bug reports from users where the application displayed an error message from SQL Server. Since the issue occurred only occasionally, it was difficult for them to reproduce the problem and find out where the error message was produced.
To solve this problem, I set up an Extended Events session that collected all exceptions that occurred in the database. I then wrote a view to be able to look at the data easily. As this was a non-trivial piece of work, I felt that this is something I wanted to share with the community so that others can benefit from it. I will first describe the events session, and I then give you a quick look at the raw data returned by the session, before I proceed to describe the view, both what it returns and how it is implemented. I also cover a stored procedure that presents one extra item which is not present in the view for performance reasons. In the last chapter, I present alternate versions to use with Azure SQL Database and (in part) with Azure SQL Managed Instance.
Different sites have different needs and not all systems are equal. Therefore, it is not unlikely that you will have reason to modify what I present here to fit your needs, and I have written the article with this in mind. I don't only discuss what you see in the view, but also how the session and the view are implemented to give you enough understanding to be able to adapt them.
The main body of this article is intended for on-prem SQL Server and the code runs on SQL 2012 and later. As noted above, the last chapter of the article covers Azure SQL. Note that this chapter only highlights the differences to the on-prem version, so if you want to understand the details, you still need to read other chapters, even if you only work in Azure.
Tip: if you want to print this article, I recommend that you set the format to Landscape to be able to fit the images without shrinking.
While I will provide you with the T‑SQL code to set up the session below, I still like to walk you through how to set up an events session through the UI in SSMS. These were the steps I took myself, and if you wish to modify the events session to fit your needs, the UI will be the easiest way to go in many cases.
You find Extended Events in Object Explorer in the Management node. When you expand the node Extended Events, you find a node Sessions. You can right-click on this node and select New Session. On the page that comes up, you need to specify a name, and you can specify that the session should start when the server starts up and a few more things. Then move over the Events page to select your events. This is a bit of hit and miss. Extended Events is not overly documented, and about the only way to find an event to fit your needs is to type a keyword and hope that it is included in an event name. For instance, if you try exception, all you get a hit on is broker_transmission_exception which is specific to Service Broker and not what we're looking for. Thankfully, when you try error, the outcome is better, and of the five events listed, the one you want is error_reported. In many X-event sessions, you want to include a number of events, but for this particular purpose, error_reported is the only one we need. Thus, you can select this one and press the right-arrow in the middle bar.
Next, press the Configure button, which shifts the screen to the right and there is a box Event configuration options with three tabs: Global Fields (Actions), Filter (Predicate) and Event Fields, as seen in this screenshot:

Note that you need to have error_reported selected in the box to the left to actually see something on the right.
I will start the description of these tabs with the Event Fields tab. Here you can view which fields that are always collected for this event, and there is also a description column, although for the error_reported event, only two of the eight fields have a description saying something useful. I will discuss these fields further when we look at the raw data.
On the tab Global Fields (Actions) you can select fields from a pool of fields that can be added to any event. These fields are often called "actions" in Extended Events parlance. For the view I will present, I have made a couple of choices among the global fields that I will return to in just an instant.
In the tab Filter (Predicate) it is possible to define conditions for when the event is to be recorded or ignored. In the Fields dropdown, you can select event fields as well as global fields. You will find that the latter come with a prefix which is not displayed in the Global Fields tab, so the order is somewhat different.
In the next page in the New Session form, you select the storage for the event session. While there are some choices, I have never used anything but a file as long as I am on-prem. (It's a different matter in Azure; we will come back to that in the Azure chapter.) When you select a file, you can set the max file size and the number of rollover files, something I will discuss below. The final page in the form is the Advanced page, and you'd better know what you are doing if you meddle here. I do not, so I did not touch it.
Once you have set up your session, you can start it and view the data in the Live Data viewer, which you find if you right-click the session in Object Explorer. This can be useful if you want to test your session to see what you get. However, I'm not sure that the Live Data viewer is practical for this particular monitoring, and I will not discuss it further in this article. Once you are satisfied with your session, you can script it from the context menu. You can also script the session directly from the Event Session form by pressing the Script button in the upper left.
When I had completed these steps, I got the event session below, although I have reformatted the output from SSMS to make it more readable and I have commented out one condition and added a statement on top to drop the session if it already exists. You also find this script in the file exception-xevent.sql.
IF EXISTS (SELECT * FROM sys.server_event_sessions WHERE name = 'Exceptions')
   DROP EVENT SESSION Exceptions ON SERVER
go
CREATE EVENT SESSION Exceptions ON SERVER
ADD EVENT sqlserver.error_reported(
    ACTION(sqlserver.session_server_principal_name,
           sqlserver.client_hostname,
           sqlserver.client_app_name,
           sqlserver.session_id,
           sqlserver.database_name,
           sqlserver.sql_text,
           sqlserver.tsql_frame,
           sqlserver.tsql_stack)
    WHERE  severity >= 11
       AND NOT sqlserver.like_i_sql_unicode_string(sqlserver.client_app_name,
                                    '%SQL Server Management Studio%')
    --  AND sqlserver.equal_i_sql_unicode_string
    --      (sqlserver.database_name, N'Northwind')
)
ADD TARGET package0.event_file (SET FILENAME = N'Exceptions.xel',
                                    MAX_FILE_SIZE = 1,
                                    MAX_ROLLOVER_FILES = 5)
WITH (MAX_MEMORY             = 512 KB,
      EVENT_RETENTION_MODE   = ALLOW_SINGLE_EVENT_LOSS,
      MAX_DISPATCH_LATENCY   = 30 SECONDS,
      MAX_EVENT_SIZE         = 0 KB,
      MEMORY_PARTITION_MODE  = NONE,
      TRACK_CAUSALITY        = OFF,
      STARTUP_STATE          = ON)
GO
ALTER EVENT SESSION Exceptions ON SERVER STATE = START
The session definition consists of several parts. The first part defines which event(s) to include, and which global fields (actions) to add to the fields that come with the event. It is worth looking at what fields I have selected, as you may want to make alterations to fit your environment.
The first three are ones that you typically collect for any sort of auditing: the user name, the host name and the application name. All of these can be helpful to find out more about the error – provided that they actually include information that is useful to you. For a system that uses an application login, the user name will always be the same (save possibly for Agent jobs), and if all connections come from an application server or a web server, the host name will always be the same. If this is the case in your shop, you may prefer to remove these fields from the definition of the event session. The application name is a little more useful, even if only one application accesses the database, since there may still be odd connections from things like SQLCMD or something else you do not have a filter for, and in that case you need to know that it was not a real application error. Thus, I recommend that you always include this field.
There is not much to say about the session id, except that I see little reason not to collect it. As for the database name, it is of little interest if you filter the session for a single database (which is what I do at my client), but as soon as your filter permits for more than one database, you absolutely need this field so that you know where the exception occurred.
The next two, sql_text and tsql_frame are essential for this session and the view that I will present. sql_text gives the batch that the client actually submitted, and tsql_frame permits you to present the very statement which caused the exception. tsql_stack gives you the full call stack of stored procedures. The view does not look at this field, but the stored procedure that I present at the end unwinds the stack. If you find that the call stack is not useful to you, you may want to remove tsql_stack from the session. (As I will return to, this is different on Azure SQL Database.)
The event definition is followed by this WHERE clause:
    WHERE  severity >= 11
      AND  NOT sqlserver.like_i_sql_unicode_string(sqlserver.client_app_name,
                                    '%SQL Server Management Studio%')
    --  AND sqlserver.equal_i_sql_unicode_string
    --      (sqlserver.database_name, N'Northwind')
The condition on severity says that I want errors only. In SQL Server, messages with a severity < 11 are not errors, but only informational messages. The next condition filters out exceptions that occur in Management Studio. Since my idea was to monitor exceptions in the application, I did not want to get noise from syntax errors from any of us working in SSMS. If you have staff members who use VS Code to run queries or any other similar tool, you may want to filter out these tools as well.
The last condition restricts the session to a single database, but for the sake of the demo, I have commented it out. When it comes to practical use, I recommend that you restrict the session to the database(s) of the application you want to monitor, or else you may get too much noise.
The ADD TARGET clause specifies where the data is to be written to. What you specify is not really a filename, but more like a template. To wit, SQL Server writes to a file until it reaches its max size, and then it opens a new rollover file. It also deletes the oldest file, once the maximum number of rollover files has been reached. When SQL Server is restarted, it always opens a new file, and this also happens if you use the script above to drop and recreate the session. The actual name for a file is something like this: Exceptions_0_132321478772460000.xel. My MVP colleague Erin Stellato tells me that the suffix reflects the number of milliseconds since Jan 1, 1601. You can specify a full path for the file name, but you may note that I have not done this, which means that the files are written to the default location which is the same folder as the SQL Server error log. (E.g., on a default instance of SQL 2019 this is C:\Program Files\Microsoft SQL Server\MSSQL15.MSSQLSERVER\MSSQL\Log.)
The clauses MAX_FILE_SIZE and MAX_ROLLOVER_FILES control the total amount of data you save. With the settings (the default I got from SSMS), this is a maximum of 5 GB (five files up to 1 GB each). In our case, I have found that this means that we have error messages a month back. I would recommend that you start with the default settings and at the same time decide on what retention time you want to have. Say that you find that one month is sufficient. After a month, you check if you have events for a month, and how much disk space the files take up. If you find that you only have data for a fortnight you have to increase MAX_FILE_SIZE and/or MAX_ROLLOVER_FILES. On the other hand, if you find that you are nowhere close to hitting the 5 GB limit, I recommend that you cut down MAX_FILE_SIZE to reduce the amount of data – this will make querying the view more efficient. I recommend against decreasing MAX_ROLLOVER_FILES below five, since in that case you could lose data if there are multiple server restarts in a maintenance window.
The WITH clause at the end are mainly settings from the Advanced page in SSMS, and I don't know what most of them mean. The exception is the last one: STARTUP_STATE. This option specifies whether the session should start when SQL Server starts. I strongly recommend that you leave this setting to be ON.
The last statement in the file starts the session right after creation.
If you want to modify the event session, you can edit the script directly if this is a simple change like removing a field you don't need or changing the file size. As noted above, dropping and recreating the session will start a new file, but the existing files will be retained, save for the oldest if you get beyond the MAX_ROLLOVER_FILES limit. If you want to add an action/field or add a filter, it is probably easier to do this in the UI, so that you don't have to bother about exact names of fields and filter functions. Just keep in mind that once you have done this, the script from my article is no longer current for you. But you can use the Script button in the UI to keep the script file up to date if you wish.
Note: Some readers may know that it is possible to use ALTER EVENT SESSION to make changes like adding or dropping a field/action from an event. Or, well, you have to drop the event from the session and re-add it with the desired actions and filters, and with a single-event session this is more or less the same as dropping and recreating the session, although there is an advantage with ALTER EVENT SESSION: the session is not stopped, and thus a new rollover file is not created. SSMS uses ALTER EVENT SESSION to change the session.
Before we look at the view, let's have a look at the raw output from the session. To have some exceptions to look at, I have a demo database and a demo script that produces a suite of exceptions. The demo database is the old Northwind database from Microsoft, which you can build by running this script. (The database is small, less than 20 MB in size.) Once you have installed the database, download the script demoscript.sql. You should run this script from SQLCMD, and not from Management Studio. There are two reasons for this:
And beware, the SQLCMD you need is the old classic one, not the new go-sqlcmd – again because of that special syntax that only works in old SQLCMD.
Once you have downloaded the demo script, open a command-line window and move to the folder where you saved the file. Then run:
sqlcmd -S YourServer\Instance -i demoscript.sql
Replace YourServer\Instance with the actual instance where you installed Northwind. The script creates a number of stored procedures in tempdb and Northwind and executes them, and most of them produce error messages – that is the whole point with the script. Just for reference, this should be the last message:
Msg 547, Level 16, State 1, Server YourServer\Instance, Line 1
The UPDATE statement conflicted with the FOREIGN KEY constraint "FK_Orders_Shippers". The conflict occurred in database "Northwind", table "dbo.Shippers", column 'ShipperID'.
The statement has been terminated.
To look at the output from the event session, SQL Server offers the function fn_xe_file_target_read_file, which you can run like this:
SELECT *
FROM   sys.fn_xe_file_target_read_file ('Exceptions*.xel', DEFAULT, NULL, NULL)
Observe the star in the file specification. It is required. Without it, there will be no output.
Note: A very quick description of the three other parameters: The second parameter is a holdover from the original design of X-Events in SQL 2008 and you always specify DEFAULT. The other two permit you to start at a specific file and offset, so that you don't have to trawl through it all.
If you don't get any output, wait a while and try again. Extended events buffers the output, and there is often a delay of 15-30 seconds or so, before the output is visible in the file. Eventually, you will see something like this:

Not all columns here are very useful. Experts may have use for the two guid columns, but I don't count myself among them. The object_name column tells you which type of event that has been captured, and this is of course useful for event sessions that capture more than one event type, but ours doesn't. The column event_data is where the actual data is, and as you may discern, this is an XML document, but the data type of the column is nvarchar(MAX). The file_name column holds the path to the physical file where the event has been written to, and file_offset gives you the position in the file. As you can see in the sample, there can be more than one event on the same offset; this appears to happen when many events occur in a short time span like when we run our demo script. The last column timestamp_utc informs you when the event was recorded, and as the name suggests, the time zone is UTC and not the local time zone of the server. This last column was added in SQL 2017 and is not available in SQL 2016 and earlier, but as you will see in a second, there is also a timestamp value inside event_data.
To actually be able to work with the data, you need to cast event_data to xml:
SELECT convert(xml, event_data), *
FROM   sys.fn_xe_file_target_read_file ('Exceptions*.xel', DEFAULT, NULL, NULL)
If you click on the XML for very first row, you should see something like this (I have abbreviated some long binary values and added some line breaks to fit the page width:
<event name="error_reported" package="sqlserver"
             timestamp="2020-04-29T20:04:47.502Z">
  <data name="error_number">
    <value>87000</value>
  </data>
  <data name="severity">
    <value>16</value>
  </data>
  <data name="state">
    <value>12</value>
  </data>
  <data name="user_defined">
    <value>true</value>
  </data>
  <data name="category">
    <value>2</value>
    <text>SERVER</text>
  </data>
  <data name="destination">
    <value>0x00000002</value>
    <text>USER</text>
  </data>
  <data name="is_intercepted">
    <value>false</value>
  </data>
  <data name="message">
    <value>This is a demo error</value>
  </data>
  <action name="tsql_stack" package="sqlserver">
    <value>
      <frames>
        <frame level="1" handle="0x01000200DCB6F92160112B9DFD010..."
               line="1" offsetStart="4" offsetEnd="-1" />
      </frames>
    </value>
  </action>
  <action name="tsql_frame" package="sqlserver">
    <value>
      <frame level="0" handle="0x01000200DCB6F92160112B9DFD010000000000000000000..."
             line="1" offsetStart="4" offsetEnd="-1" />
    </value>
  </action>
  <action name="sql_text" package="sqlserver">
    <value>; THROW 87000, 'This is a demo error', 12
</value>
  </action>
  <action name="database_name" package="sqlserver">
    <value>tempdb</value>
  </action>
  <action name="session_id" package="sqlserver">
    <value>57</value>
  </action>
  <action name="client_app_name" package="sqlserver">
    <value>SQLCMD</value>
  </action>
  <action name="client_hostname" package="sqlserver">
    <value>SOMMERWALD</value>
  </action>
  <action name="session_server_principal_name" package="sqlserver">
    <value>SOMMERWALD\sommar</value>
  </action>
</event>
What is all this? The root element has a timestamp attribute which is useful if you are on SQL 2016 or earlier where timestamp_utc is not available. This timestamp, too, is in UTC, not in the local time zone of the server. There are a number of data elements. They hold the values of the fields specific to the error_reported event. Here is a short description of them: error_number, severity and state are the same values that you see in an error message in SSMS, and as noted previously, the event session filters on the severity field. user_defined is true if the error was raised with RAISERROR or ;THROW else false. Possibly this is a candidate for filtering, if you only want to see exceptions raised by SQL Server. I have not been able to figure out what category and destination mean, but nor have I spent a lot of time on investigating them. is_intecepted is true if the exception was caught by TRY-CATCH, regardless whether the CATCH block re-raised the error with ;THROW or not. Thus, in a well-written system that uses TRY-CATCH throughout, this field is of little interest, as it will almost always be true. Finally, message is the actual error message and this is of course the heart of the matter.
The data elements are followed by action elements which hold the values of the global fields/actions we added to the event. I have already discussed these, so I will only briefly mention the handles that appear with the tsql_frame and tsql_stack fields. This is the same sql_handle that you see in sys.dm_exec_query_stats and other places. We will look at these a little more later.
We are now ready to look at the view that I have been talking about throughout the article. There are three versions of this view, of which I will cover two here, and come back to the third version in the chapter on Azure.
In view_exceptions.sql you find a version that runs on SQL 2017 and later. If you are on SQL 2012, SQL 2014 or SQL 2016, you need to use the version in view_exceptions_2016.sql instead. When you run the script, it will create the view in the Northwind database. When you use it for real, you can put it in the database of your choice.
If you run this query
SELECT * FROM view_exceptions ORDER BY when_
The left half of what you see will look something like this:

These columns should be self-evident from what we have discussed earlier, and only the column when_ warrants a comment: As opposed to the raw XML, the timestamp is in the local time zone of the server and not in UTC. (The column has a trailing underscore in the name, since WHEN is a reserved keyword in T‑SQL.)
The right half of the output is the more interesting one.
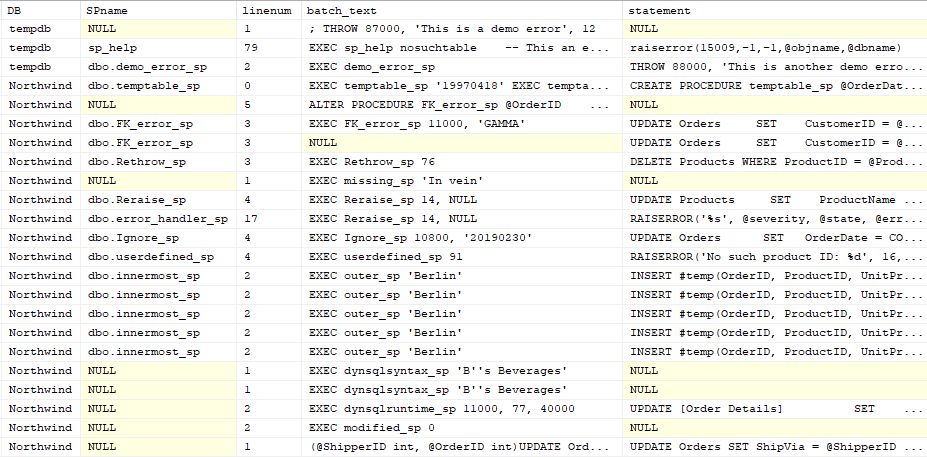
The columns DB and SPname inform you in which database and stored procedure (or function or trigger) where the exception occurred. As you see, SPname is NULL for several entries. There are several possible reasons for this:
On the other hand, the module name will still display if the plan for the module has fallen out of the cache, since the handle includes sufficient information to look up metadata from the system catalog.
The column linenum is the line number in the module or batch where the exception occurred. As the line number is collected by the extended event, there is always a value in this column.
The column batch_text holds the SQL Command submitted by the client. You may note that this column is NULL in one place, despite that the same procedure and the same error occur on the line above. How did this happen? If you look into the demo script, you will find this:
EXEC FK_error_sp 11000, 'GAMMA'
go
{call FK_error_sp (10555, 'DELTA')}
The last line does not look like T‑SQL, and indeed it is not. SQLCMD uses ODBC to connect to SQL Server, and this line is intercepted by the ODBC driver and it results in an RPC call. (RPC = Remote Procedure Call). In this case, there is no EXEC statement per se, but it is a special packet in the TDS protocol wherein the client passes the procedure name and the parameters. There is an important reason why I threw in this odd piece of syntax (which does not work in SSMS or go-sqlcmd): A well-written application should call all stored procedures through RPC. So, while the column batch_text is populated for all but this single line in this demo, you may find that when you use view_exceptions to look at the exceptions in your database that batch_text is almost always NULL.
Finally, the column statement is the very statement where the exception occurred. As you can see, this column too can be NULL at times. Possible reasons for this include:
Tip: To see the entire batch or statement, you may get the idea to copy the text to a query window only to find that it is one long line. Modern versions of SSMS have a setting to control this. Go to Tools->Options->Query Results->SQL Server->Results to Grid. Here you find the setting Retain CR/LF on copy or save. I always have this setting checked, but I believe that it defaults to unchecked. (Which is what you want when you copy to Excel.)
Let's now look at the view definition itself. The view consists of three CTEs and a main query, and I will discuss them one by one. The first CTE reads the data from sys.fn_xe_file_target_read_file and makes the initial transformations.
 WITH CTE AS (
   SELECT cast(event_data AS xml) AS xml,
          row_number() OVER(ORDER BY timestamp_utc) AS eventno,
          cast(dateadd(HOUR,
                   datediff(HOUR, getutcdate(), getdate()), timestamp_utc)
              AS datetime2(3)) AS when_
   FROM   sys.fn_xe_file_target_read_file ('Exceptions*.xel', DEFAULT, NULL, NULL)
)
I do three things here:
You may also notice that I change the data type of the timestamp from datetime2(7) to datetime2(3). Timestamps in SQL Server never have more than millisecond precision, so there is no reason to drag around extra digits.
The next CTE extracts values from the XML document:
), extracted AS (
   SELECT when_, eventno,
          D.d.value('@name', 'nvarchar(128)') AS name,
          D.d.value('(value/text())[1]', 'nvarchar(MAX)') AS value,
          convert(varbinary(85),
              F.f.value('@handle', 'varchar(200)'), 1) AS sql_handle,
          F.f.value('@line', 'int') AS linenum,
          F.f.value('@offsetStart', 'int') AS stmt_start,
          F.f.value('@offsetEnd', 'int') AS stmt_end
   FROM   CTE
   CROSS  APPLY CTE.xml.nodes('/event/*') AS D(d)
   OUTER  APPLY D.d.nodes('value/frame') AS F(f)
)
The columns when_ and eventno are just brought over from the previous CTE. (In the version for SQL 2016 and before, when_ is computed in this CTE.) The columns name and value extract values from the data and action tags. The remaining four columns – sql_handle, linenum, stmt_start and stmt_end – extract values from the action tag for the tsql_frame field.
If you take out only these two CTEs and run a SELECT * FROM extracted, you will see a result set where there are 16 rows for each exception with name/value pairs. The value column is NULL for the tsql_stack and tsql_frame actions, but for tsql_frame, the columns sql_handle and on have values whereas they are NULL for the remaining rows.
This is still not very nice to look at, so we need a third CTE to pivot the data, so that each field becomes a column:
), pivoted AS (
   SELECT eventno, when_,
          MIN(CASE name WHEN 'client_app_name' THEN value END) AS appname,
          MIN(CASE name WHEN 'client_hostname' THEN value END) AS hostname,
          MIN(CASE name WHEN 'session_server_principal_name' THEN value END)
                                                                     AS username,
          MIN(CASE name WHEN 'error_number' THEN CAST(value AS int) END) AS errno,
          MIN(CASE name WHEN 'message' THEN value END) AS errmsg,
          MIN(CASE name WHEN 'database_name' THEN value END) AS DB,
          MIN(CASE name WHEN 'sql_text' THEN value END) AS batch_text,
          MIN(CASE name WHEN 'tsql_frame' THEN sql_handle END) AS sql_handle,
          MIN(CASE name WHEN 'tsql_frame' THEN linenum END) AS linenum,
          MIN(CASE name WHEN 'tsql_frame' THEN stmt_start / 2 END) AS stmt_start,
          MIN(CASE name WHEN 'tsql_frame' THEN IIF(stmt_end = -1, 1000000000,
               (stmt_end - stmt_start) / 2 + 1) END) AS stmt_len
   FROM   extracted
   GROUP BY eventno, when_
)
This is a standard pivoting operation implemented with MIN and CASE where the purpose of the MIN is not to get the smallest value, but the only non-NULL value that matches the WHEN condition for this particular group in the GROUP BY clause. This permits me to combine many rows into a single row. This requires that the columns in the GROUP BY clause are unique for each group, and this is why I need eventno here; when_ is not sufficient, since two events could have the same timestamp. Some readers may be used to using the PIVOT operator for pivoting, but I find this style to be a lot more flexible. For instance, above tsql_frame appears several times so that I get all values particular to that field. You may see that I divide the value in stmt_start by 2 and replace stmt_end with a stmt_len column. This is in preparation for the extraction of the statement in the final step.
If you would add or delete fields (actions) from the event session, you would also need to edit this CTE to adapt the view to those changes. (On the other hand, you would rarely have reason to touch the first two CTEs.)
The final step in the view definition returns the data from the pivoted CTE.
SELECT p.when_, p.username, p.hostname, p.appname, p.errno, p.errmsg, p.DB,
       CASE WHEN est.dbid = 32767 THEN object_name(est.objectid)
            ELSE object_schema_name(est.objectid, est.dbid) + '.' +
                 object_name(est.objectid, est.dbid)
       END AS SPname,
       p.linenum,  p.batch_text,
       substring(est.text, stmt_start + 1, stmt_len) AS statement
FROM   pivoted p
OUTER  APPLY sys.dm_exec_sql_text(p.sql_handle) est
Here I call sys.dm_exec_sql_text to extract the batch where the exception occurred, and then I use stmt_start and stmt_len to extract the very statement. While non-trivial, this is a standard operation which also comes up if you want to extract statements from sys.dm_exec_query_stats, to mention one example. If the sql_handle represents a stored procedure, sys.dm_exec_sql_text also returns an object id and a database id. To translate them to object names, I use various system functions, so that the translations work with any database on the server. You may wonder about the handling of database id 32767. This is the resource database where the system procedures live. Their ids translate in any database – as long as you don't send in dbid = 32767.
If you add or remove fields from the event session, you obviously need to update this part of the view, but it is only the first line in the SELECT list you should touch. (Unless you want to change the column order.)
When you use the view in practice, you would typically run a query like this:
SELECT * FROM view_exceptions
WHERE when_ >= '20200501'
ORDER BY when_ DESC
where the date would be a few days back. Don't forget the ORDER BY clause; a view has no inherent order. If you want to filter for a certain database, a certain error etc, you can of course easily add a condition to the WHERE clause to do so.
If your application uses a high degree of procedure nesting, you may not be content with only seeing the procedure where the error occurred, but you would like to see the full call stack to get a better understanding of what caused the exception. This is why I collect the field/action tsql_stack in the event session. My first attempt was to add the call stack to view_exceptions. I had to create three more CTEs and I joined the last of them to the pivoted CTE in the final query on the eventno column. I got the desired result, but performance was awful.
To work around this, I wrote a stored procedure list_exceptions_sp which is based on the view, but where I materialise the extracted CTE into a temp table with eventno and name as the primary key. This gave me a response time that I found tolerable. As with the view, there are three versions of the stored procedure. list_exceptions_sp.sql runs on SQL 2017 and later, whereas list_exceptions_sp-2016.sql is intended for SQL 2016 and earlier. I will come back to the version for Azure in the Azure chapter. I am not presenting the code for the extra CTEs here, but I only discuss the output.
The procedure takes one parameter @since which is a datetime2(3) value. Only exceptions that occurred after (or on) @since are listed. If you leave it out, the procedure will return exceptions that have occurred in the last 24 hours. The exceptions are returned sorted in descending order on the when_ column. The SP returns the same columns as the view, and adds a final column callstack. Here is how this column looks like for our demo script. To make it a little easier to follow, I have also included the column batch_text.

For each entry in the call stack, the procedure lists the procedure name and the line number. As I discussed earlier, there are situations when sys.dm_exec_sql_text will not return anything for a handle in a call frame. In this case, the procedure lists NULL for that entry. If this happens for all frames on the call stack, the SP returns a plain simple NULL value.
You may note that almost all rows have a NULL first in the call stack. This is because the top item of the stack is a batch that consists of a single EXEC statement, and this batch is not cached. But there is one entry which does not have the leading NULLs, and for this entry batch_text is NULL. You may recall that this was line in the demo script:
{call FK_error_sp (10555, 'DELTA')}
That is, the special ODBC syntax that emulates a call from an application. Thus, when you try the procedure for real with your system, you may not see that many leading NULL, if the application calls stored procedures through RPC as it should.
In a few places it says <Ad-hoc>. On the line with the call to dynsqlruntime_sp, this is dynamic SQL executed from inside a stored procedure. (Note that you see sp_executesql on the call stack.) The more interesting line is the one on top, where the call stack reads NULL - <Ad-hoc>/1. The text in the demo script that produces the error looks like this:
{call sp_executesql(N'UPDATE Orders SET ShipVia = @ShipperID
                      WHERE OrderID = @OrderID',
                    N'@ShipperID int, @OrderID int', 54, 10248)}
This is again that special syntax that only works in SQLCMD and which emulates an application. To wit, if your application submits SQL directly without using stored procedures, you can expect to see this pattern frequently in the callstack column. It goes without saying that for that type of application the callstack column will not be very useful, but not all systems are the same.
If you are in Azure SQL Managed Instance or Azure SQL Database, there are a two things that are different from on-prem:
Let's start with the target. You can use the file target in the cloud as well, but since you don't have access to the local file system, you cannot write to a file. You can however write to Azure BLOB store, so all you need to do is to change the filename in the definitions of the events session, the view and the procedure to a URL to your BLOB store. I would guess reading from remote storage is slower than reading from a local file, but I have not tested.
While this sounds easy enough, I often hear people moan when you mention BLOB storage. It's not the performance, but the red tape that comes with it. As a DBA, you may not have permissions to just go and create files in BLOB store, and it is not you that need the permissions – it's the Azure server. For this reason, I will in this chapter look into the alternative of using the ring-buffer target for the extended-event session.
The advantage of the ring buffer over a file target in BLOB store is that there is no hassle to set it up – it is just there. But I should say immediately that if you are lucky to already have everything set up to use BLOB store, that is the way to go, because the ring buffer comes with some downsides. The ring buffer lives in memory, so if there is a failover (which can be induced by the Azure service for maintenance), the contents of the ring buffer is lost, whereas with the file target you have full control over how long the data is kept. Performance is another downside that I will come back to. Nevertheless, the ring buffer can be good enough.
In the following, I will present files that are geared for using the ring buffer on Azure SQL Database. This means that if you are on Managed Instance and use the ring buffer, you will have to combine parts from the on-prem scripts with the scripts for Azure SQL Database. The same applies if you are on Azure SQL Database and want to use the file target rather than the ring buffer.
Let's look at the definition of the extended-events session. The full definition is in the file exception-event_azure.sql. Let's start with looking at the definition of the target, which looks like this
ADD TARGET package0.ring_buffer (SET MAX_MEMORY = 0,
                                     MAX_EVENTS_LIMIT = 1000)
You can control the size of the ring buffer either by memory or by number of events. The settings above are the default that were suggested to me by SSMS when I set up the session. MAX_MEMORY = 0 means that the memory is unbounded and instead the cap is by number of events. There may be reasons to lower this number that I will come back to.
If you are on Azure SQL Database and you want to use the file target, you would use these three lines from the on-prem version rather than lines above:
ADD TARGET package0.event_file (SET FILENAME = N'<path to BLOB store',
                                    MAX_FILE_SIZE = 1,
                                    MAX_ROLLOVER_FILES = 5)
On the other hand, if you are on Managed Instance and want to use the ring buffer, you should replace these lines in the on-prem version with the two lines above.
The first part of the session definition looks like this:
CREATE EVENT SESSION [Exceptions] ON DATABASE
ADD EVENT sqlserver.error_reported(
    ACTION(sqlserver.client_app_name,
           sqlserver.client_hostname,
           sqlserver.database_name,
           sqlserver.session_id,
           sqlserver.sql_text,
           sqlserver.tsql_stack,
           sqlserver.username)
    WHERE ([severity]>=(11)
      AND NOT [sqlserver].[like_i_sql_unicode_string]([sqlserver].[client_app_name],
                    N'%SQL Server Management Studio%')))
There are a couple of differences from the definition for on-prem SQL Server:
The last part of the session definition with advanced options is the same as in the on-prem version. Well, there is one difference that I don't know if it matters. But as with the on-prem version, I have retained the defaults from SSMS.
Let's now turn to view_exceptions. You find the Azure version in the file view_exceptions-azure.sql. The most important difference is due to the use of the ring buffer. This part:
WITH CTE AS (
   SELECT cast(event_data AS xml) AS xml,
          row_number() OVER(ORDER BY file_name, file_offset) AS eventno
   FROM   sys.fn_xe_file_target_read_file('Exceptions*.xel', DEFAULT, NULL, NULL)
)
is replaced by no less than three CTEs:
WITH ring_buffer AS (
   SELECT data = CAST(st.target_data AS XML)
   FROM   sys.dm_xe_database_session_targets AS st
   JOIN   sys.dm_xe_database_sessions AS s ON s.address = st.event_session_address
   WHERE  s.name = N'Exceptions'
     AND  st.target_name = N'ring_buffer'
), events AS (
   SELECT D.d.query('.') AS xml,
          D.d.value('@timestamp', 'datetime2(3)') as timestamp_utc
   FROM   ring_buffer
   CROSS  APPLY data.nodes('/RingBufferTarget/event') AS D(d)
), events2 AS (
   SELECT xml, row_number() OVER(ORDER BY timestamp_utc) AS eventno,
          dateadd(HOUR,
             datediff(HOUR, getutcdate(), getdate()), timestamp_utc) AS when_
   FROM   events
)
The first CTE reads the ring buffer and gets back a single XML document with all events. The next CTE extracts the individual events as XML as well as the time in UTC. The CTE events2 gives all events a unique number and translates the time to the time zone of the database (which is likely to be UTC anyway).
The rest of the view is quite similar to the on-prem version with some smaller differences. The most notable is that the current statement is found through the data collected by the tsql_stack action, since tsql_frame is not available. (And, yes, I could have used tsql_stack in the on-prem version as well, but I did not care to change that version of the view.)
You could argue that the Database column is redundant, since the event session is confined to the database. Nevertheless, I have retained it, but feel free to remove it.
If you want to run the demo script that I presented earlier, you can do so. Create an Azure database of some cheap model, like S0 or even Basic. Then run an Azure version of the installation script for Northwind. There is also an Azure version of the demoscript which does not exclude the statements in tempdb from the on-prem version. You can run the script like this:
SQLCMD -S yourserver.database.windows.net -d Northwind -U user -P pwd -i demoscript_azure.sql
If you prefer to use Entra authentication, replace -U and -P with the appropriate options. The script produces the same exceptions as the on-prem version, except for the initial exceptions in tempdb. You can view the exceptions in the view with this SELECT:
SELECT * FROM view_exceptions ORDER BY when_
As the output is the same as for the on-prem version, I don't show any screenshots.
Now for the bad news. While the view works for the demo, it is not fun when the number of events grows. Originally, when I tested things out, I did not have Northwind in my Azure server, but I had an inflated version of the database with a million orders. The way the demo script is written, it produced a lot more exceptions, and I might have filled up the ring buffer. My SELECT query just kept spinning until I grew tired of it and pressed the red button. If you absolutely want to use the view, you will need to set a lower cap for the number of events in the ring buffer. Exactly how low I have not investigated, and it is likely to depend how well provisioned your database is. But you may have to go as low as 100.
A better option is to use the Azure version of the stored procedure list_exceptions_sp where I materialise the XML document from the ring buffer into a temp table and this makes the performance fully adequate. I don't go into details of the differences between the on-prem and Azure versions of the SP, as they are the same for the view. Except that the first CTE in the view is replaced by the temp table I mentioned.
I have introduced you to an Extended Events session that collects exceptions that occur on your server or in your Azure database, accompanied by a view and a stored procedure that permit you to look at the data collected by the session. I have given a fairly detailed description of the events session and the view, so that you can adapt them to your needs.
I'd like to remind you that in the on-prem version of the event session I presented, the filter for the database name is commented out. This is good for the demo, and the curious reader may make some interesting revelations on what is going on your server. However, for practical use, I think you will get too much noise this way. If you have a single application on the server, filter the session for its database(s). If you have databases for multiple applications on your server, filter the session for all databases where you want to monitor exceptions. You could create a view in each database where each view filters for the local database, so that persons responsible for the specific database only get to see their exceptions.
That brings us to one point I have not covered yet: permissions and security. To run sys.fn_xe_file_target_read_file or access the ring buffer you need a permission that not everyone may have. The exact permission depends on your SQL Server version:
On Azure SQL Database, the permissions may not be much of an issue, because a user interested in seeing the permissions may already be member of db_owner, and thus have the permissions. It may be more complex on on-prem or Azure SQL Managed Instance. If you are the server-level DBA and a member of sysadmin, you have the required permission. But persons who are only responsible for a single database may not have any server-level permission at all. Nevertheless, they could still have interest in seeing exceptions occurring in their database. To use the view, they need to have the required permissions; there is no way around that. The problem with granting these users VIEW (SERVER) PERFORMANCE STATE is that they may be able to see data they should not have access tp. There is a solution to this that permits these users to run list_exceptions_sp without being granted any server-level permission: You sign the procedure with a certificate and create a login from that certificate and grant that login the required permission. This is a technique that I discuss in a lot more detail in my article Packaging Permissions in Stored Procedures.
Finally, I'd like to say that I welcome any questions or comments you may have on article. And that most emphatically includes pointing out grammar and spelling errors. Just drop me a line on esquel@sommarskog.se.